New Graph Interpretation Course for Injection Molding
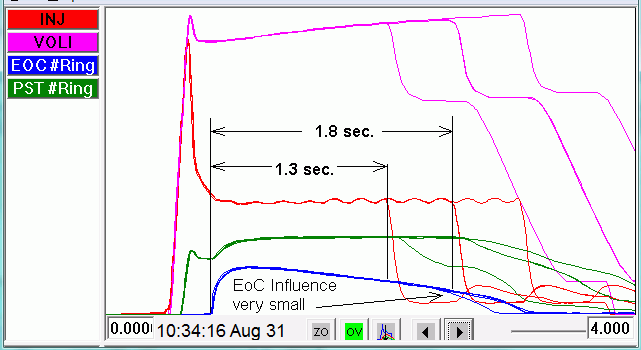
RJG’s newest training course—Graph Interpretation for Injection Molding— introduces the principles of Decoupled Molding and the cavity pressure curves associated with such processes.
RJG has introduced a three-day Graph Interpretation Course for injection molding in support of the Decoupled Molding process the company trains on and supplies equipment for. Designed for technical and non-technical personnel involved in thermoplastic injection molding, the Graph Interpretation Course provides both classroom and hands-on training, covering practical applications that introduce the principles of Decoupled Molding and the curves associated with such processes.
Areas covered include the Decoupled Molding cycle; how graphs work; graph scaling; overlays and templates; cycle graphs; summary graph data; bar graphs; alarms or limits for abnormal cycle detection; and identifying mold, machine and process issues using curves. The first course will be held in Kannapolis, N.C. on Dec. 13-15, 2022. RJG recommends that attendees have a basic understanding of the injection molding process.

RJG’s newest course will teach attendees how to interpret the graphs that chart a decoupled molding process.
Photo Credit: RJG
Related Content
-
How to Design Three-Plate Molds, Part 1
There are many things to consider, and paying attention to the details can help avoid machine downtime and higher maintenance costs, and keep the customer happy.
-
Back to Basics on Mold Venting (Part 1)
Here’s what you need to know to improve the quality of your parts and to protect your molds.
-
Back to Basics on Mold Venting (Part 2: Shape, Dimensions, Details)
Here’s how to get the most out of your stationary mold vents.


